


Mega Doctor News

The Links below will take you directly to the interactive map at the CDC:
https://gis.cdc.gov/grasp/fluview/main.html
https://www.cdc.gov/flu/weekly/

The flu is spiking in certain areas of the country already. The CDC has an interactive map that you can track what is going on in your area
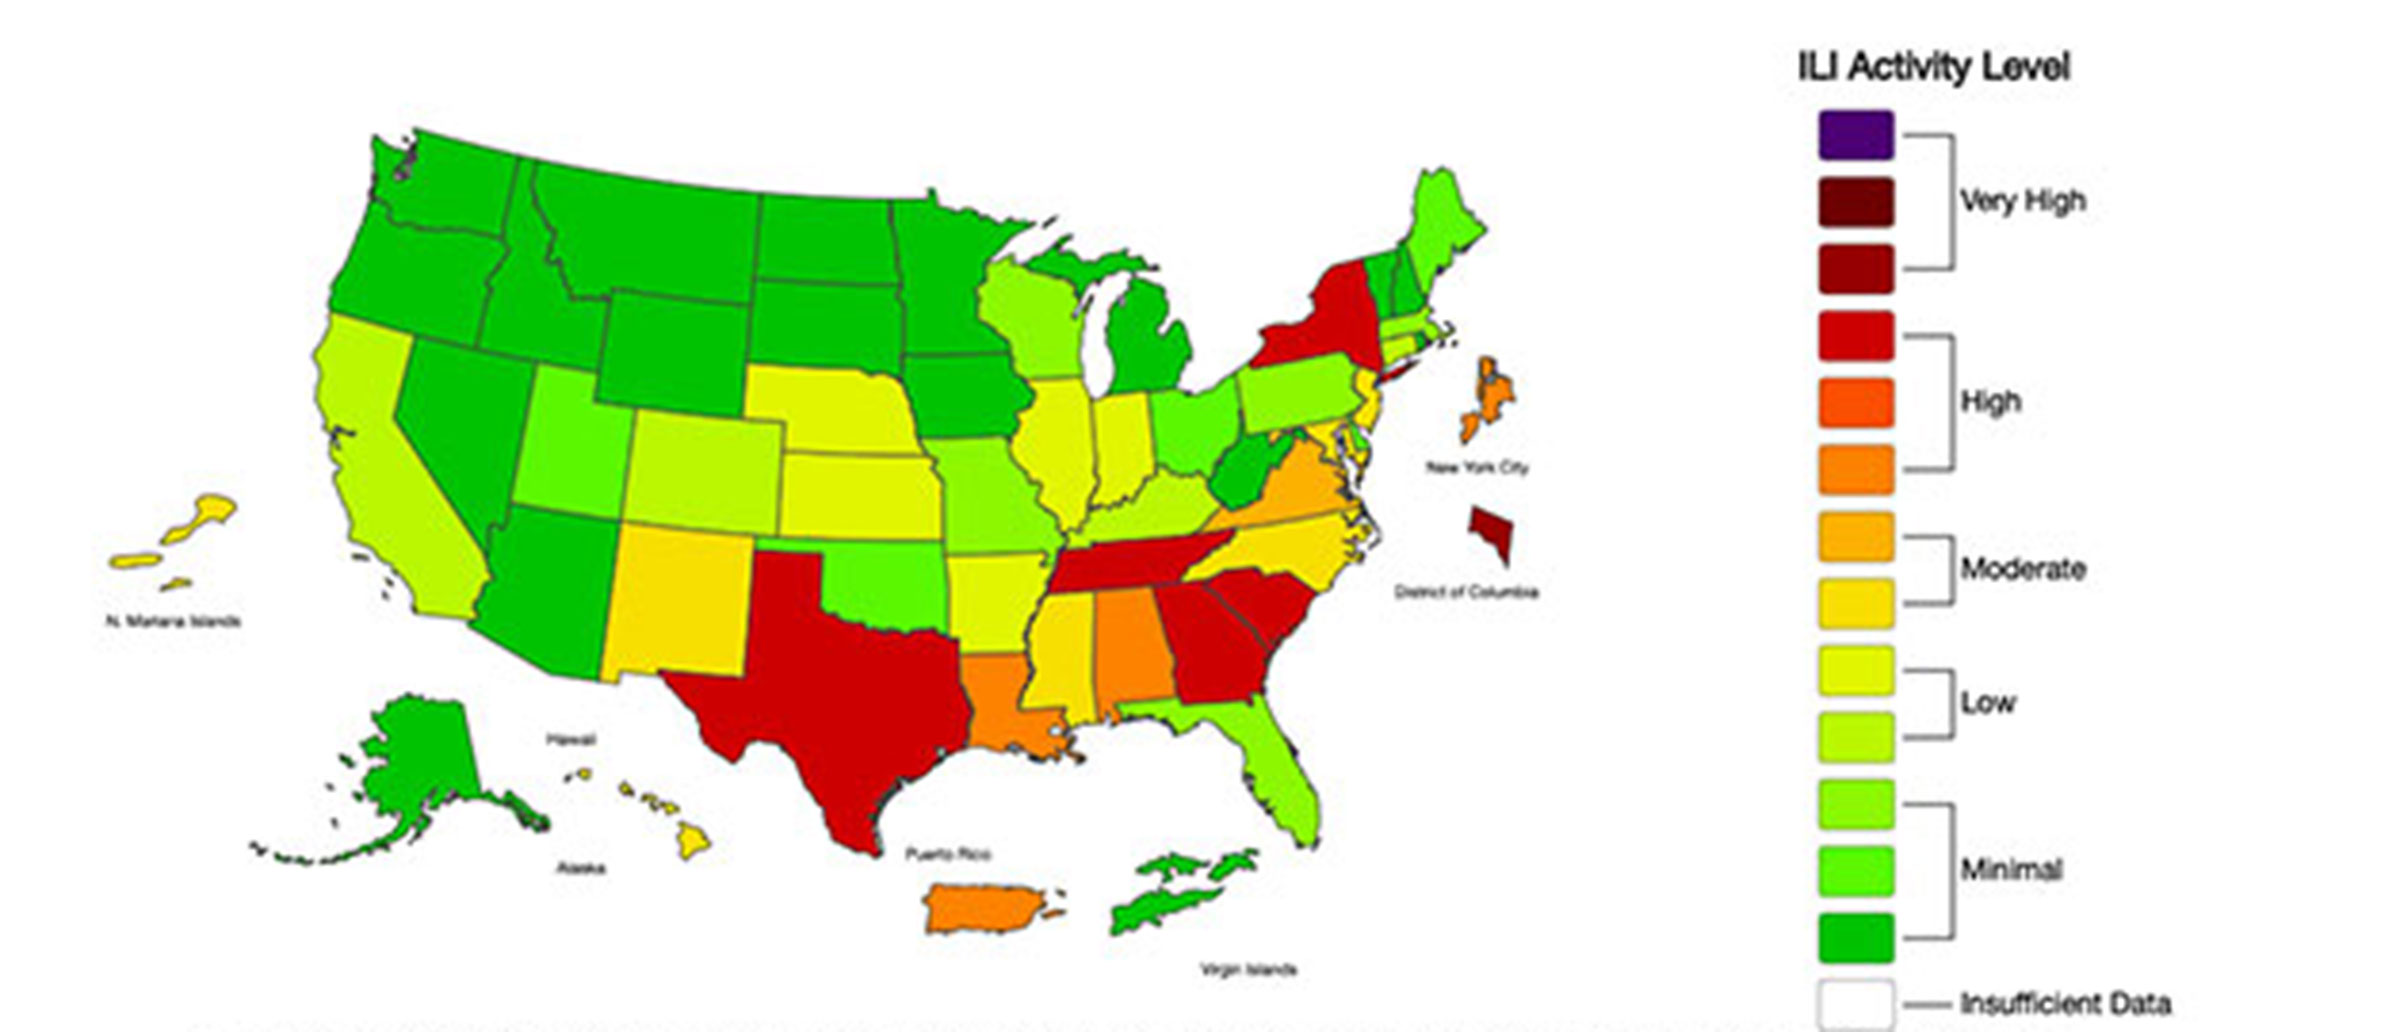
This system monitors visits for respiratory illness that includes fever plus a cough or sore throat, also referred to as ILI, not laboratory confirmed influenza and may capture patient visits due to other respiratory pathogens that cause similar symptoms.
A Weekly Influenza Surveillance Report Prepared by the Influenza Division
Outpatient Respiratory Illness Activity Map Determined by Data Reported to ILINet
This system monitors visits for respiratory illness that includes fever plus a cough or sore throat, also referred to as ILI, not laboratory confirmed influenza and may capture patient visits due to other respiratory pathogens that cause similar symptoms.
*Data collected in ILINet may disproportionately represent certain populations within a state, and therefore may not accurately depict the full picture of influenza activity for the whole state.
*Data displayed in this map are based on data collected in ILINet, whereas the State and Territorial flu activity map are based on reports from state and territorial epidemiologists. The data presented in this map is preliminary and may change as more data is received.
*Differences in the data presented by CDC and state health departments likely represent differing levels of data completeness with data presented by the state likely being the more complete.
*For the data download you can use Activity Level for the number and Activity Level Label for the text description.sp/fluview/main.html. CDC Image